Quantitative Experiments
The quantative experiments were utilsed to gain a detailed understandng of how the PV system interfered with the volume of air in which a person would sit. The experiments took a number of forms from volume flow analysis, flow time response and energy useage. The details of how each of these experiments was carried out will be discussed below.
Experimental Set-Up
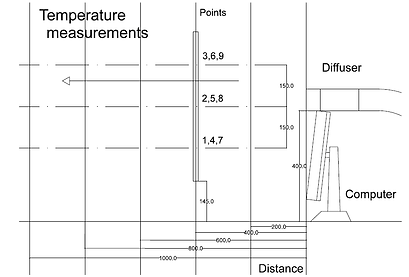
All experiments were conducted in 4.5×7.3m rooms within the Livingstone Tower. The mean indoor temperature within the room was controlled to around 20℃ with a relative humidity of 50%. The solar radiation from windows was minimized by the use of blinds. The fan was placed in the corridor through a door and the gaps were sealed to minimise the potential for drafts. The flexible pipe sections were then directed to the desk where the end of the system was clamped to the desk and the diffuser head applied. This was then adjusted in order to ensure the diffuser head was at the correct height above the desk of 0.45m and at the correct orientation. All the control system elements were located on an adjacent table and wired as discussed in the control system hardware page linked here. A full schematic of the floor plan for the experiments can be seen below. It is also important to note that the same experimental set-up has been used for the qualititive experiments discussed here.

Flow Testing - Volume
In order to carry out the test procedure, the testing frame was used to 'map' the volume. The centre of the frame was placed in front of the centre of the diffuser head at an initial distance of 0.2m. The results for all the temperature sensors and humidity sensor were then recorded at increments of 0.2m as the frame moved back to a final distance of 1m. The results for the sensors were taken on demand at each location, and the values were averaged over the past eight results within LabVIEW. The three repetitions were conducted at each condition and were averaged in order to reduce inaccuracies in the measurement. The average values were then compared to the initial conditions to see how the volume of air was affected by the presence of the system. The nine specified flow conditions at which the experiment was carried out can be seen in the table provided.
Flow Testing - Time

Whilst the volume testing provides an understanding of how the system affects a volume of air, it does not give an insight into how the system affects the air through time. In order to evaluate this, transient testing was carried out with the testing frame fixed 0.6m from the diffuser head. The system was then operated over a period of around twelve minutes at the conditions specified in the table. Within this experiment the results were not generated on demand but were programmed to be written every second, with four readings being taken and averaged per second. During this test the 20°C temperatures were deemed unnecessary as the room temperature was already 20°C and subsequently only negligible changes were observed.
Energy Testing
The energy consumption of the system is a parameter of great importance. In order to be able to compare the energy consumption to that of a conventional HVAC system, the energy usage of the PV system needed to be measured. In order to do this, the conditions were set to the worst case for energy of the highest fan speed at 24°C (i.e. high temperature increase and large volume of air). To begin to determine the energy consumption the primary goal was to determine the energy consumption by the heating system. This was accomplished by running the system for nearly an hour and recording second-by-second the state of the relays in LabVIEW. With a measure of how much time the relays spent 'on', the power consumption of the heaters could be calculated.